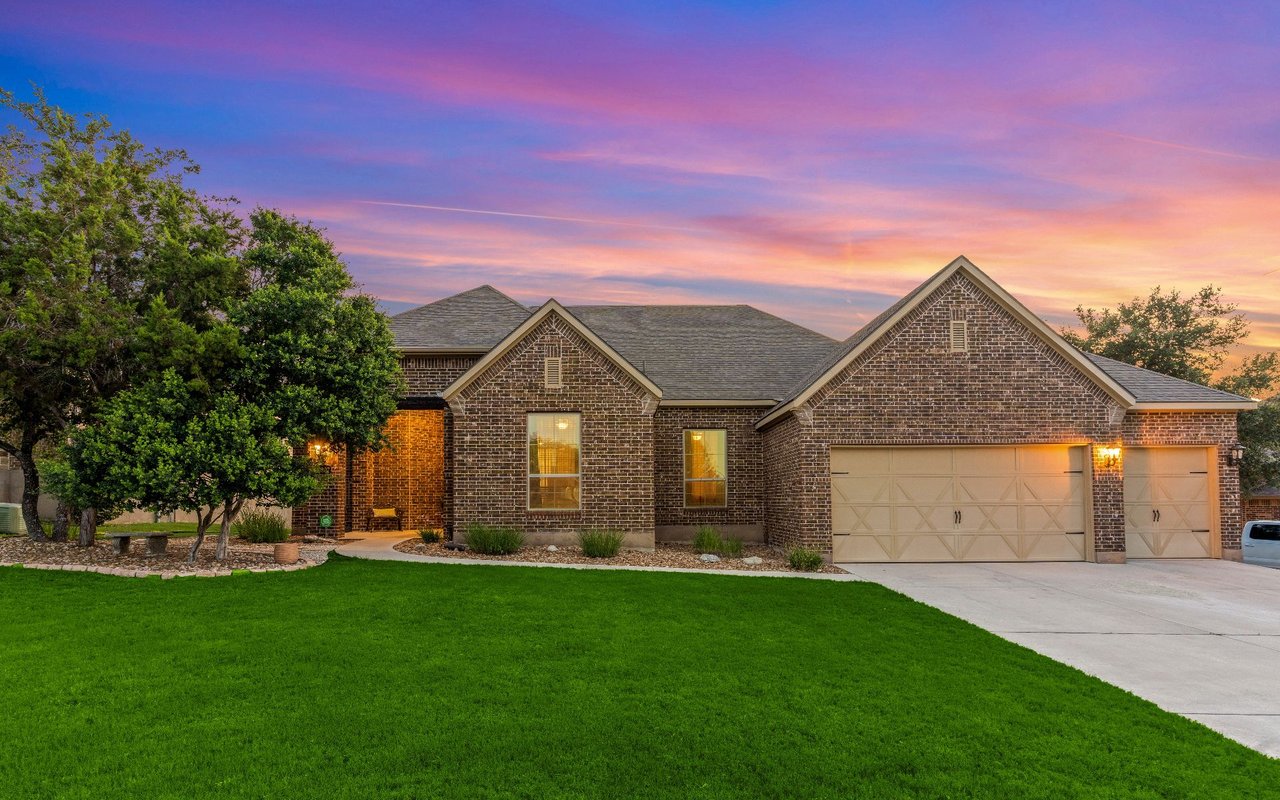
Canyon Creek is a well-established suburban neighborhood in far northwest Richardson, Texas, known for its leafy streets, strong community vibe, and a mix of classic homes and newer construction. The area centers around Canyon Creek Country Club, offering golf, tennis, swimming and dining, and is close to parks, creeks, and trails that make outdoor living easy and scenic.
8,197 people live in Canyon Creek, where the median age is 42 and the average individual income is $71,472. Data provided by the U.S. Census Bureau.
Total Population
Median Age
Population Density Population Density This is the number of people per square mile in a neighborhood.
Average individual Income
There's plenty to do around Canyon Creek, including shopping, dining, nightlife, parks, and more. Data provided by Walk Score and Yelp.
Explore popular things to do in the area, including Johnson Creams, Ahn's Tae Kwon Do, and Lee's White Leopard Kung Fu School.
| Name | Category | Distance | Reviews |
Ratings by
Yelp
|
|---|---|---|---|---|
| Dining | 4.84 miles | 5 reviews | 5/5 stars | |
| Active | 3.31 miles | 8 reviews | 5/5 stars | |
| Active | 3.94 miles | 5 reviews | 5/5 stars | |
| Active | 4.17 miles | 6 reviews | 5/5 stars | |
| Active | 4.29 miles | 9 reviews | 5/5 stars | |
| Beauty | 4.68 miles | 6 reviews | 5/5 stars | |
| Beauty | 2.04 miles | 5 reviews | 5/5 stars | |
| Beauty | 1.77 miles | 9 reviews | 5/5 stars | |
| Beauty | 2.82 miles | 5 reviews | 5/5 stars | |
|
|
||||
|
|
||||
|
|
||||
|
|
||||
|
|
||||
|
|
Canyon Creek has 3,033 households, with an average household size of 3. Data provided by the U.S. Census Bureau. Here’s what the people living in Canyon Creek do for work — and how long it takes them to get there. Data provided by the U.S. Census Bureau. 8,197 people call Canyon Creek home. The population density is 5,295.795 and the largest age group is Data provided by the U.S. Census Bureau.
Total Population
Population Density Population Density This is the number of people per square mile in a neighborhood.
Median Age
Men vs Women
Population by Age Group
0-9 Years
10-17 Years
18-24 Years
25-64 Years
65-74 Years
75+ Years
Education Level
Total Households
Average Household Size
Average individual Income
Households with Children
With Children:
Without Children:
Marital Status
Blue vs White Collar Workers
Blue Collar:
White Collar:
A qualified agent with years of experience in the real estate market can help you determine the best improvements to make based on your particular market. When you’re ready to learn more, connect with us today. We’re happy to help!